QUALITY ANALYTICS ASSOCIATES (QAA)
Everyone has been through some type of training and feedback process, whether it was your college writing class or a company-wide discrimination and harassment training. But, most of the time it seems like the feedback is ignored. There is nothing more frustrating than taking the time to give an organization honest and specific feedback only to feel like no one is actually reading what you wrote. The truth is, sometimes an organization doesn’t have the resources to review all of the feedback, or by the time they do everyone else has moved on and forgotten about it.

Corporate training can be a huge expense for companies, and it is important to the companies that their employees are getting something out of the training. Quality Analytics Associates (QAA) specializes in training programs and is working on projects to develop and enhance large scale training operations. Part of this includes gathering feedback and making recommendations - which is where Bintel comes in.
QAA and Bintel are partnering together to deliver a comprehensive and data-backed training model for use by large operations. QAA will use their years of expertise in training to lead successful projects and ensure that companies are making good decisions for their employees when it comes to their training programs and Bintel will support QAA by giving them the data and statistics to guide their recommendations.
Survey analytics is one of Bintel’s core competencies, so working with QAA is a perfect fit. QAA & Bintel will work with clients to determine the themes or topics that they want to track in the free text responses. Then Bintel will take those topic descriptions and build Topic Agents for each theme or topic. These Topic Agents will be used to classify the free text responses from the post-training survey.
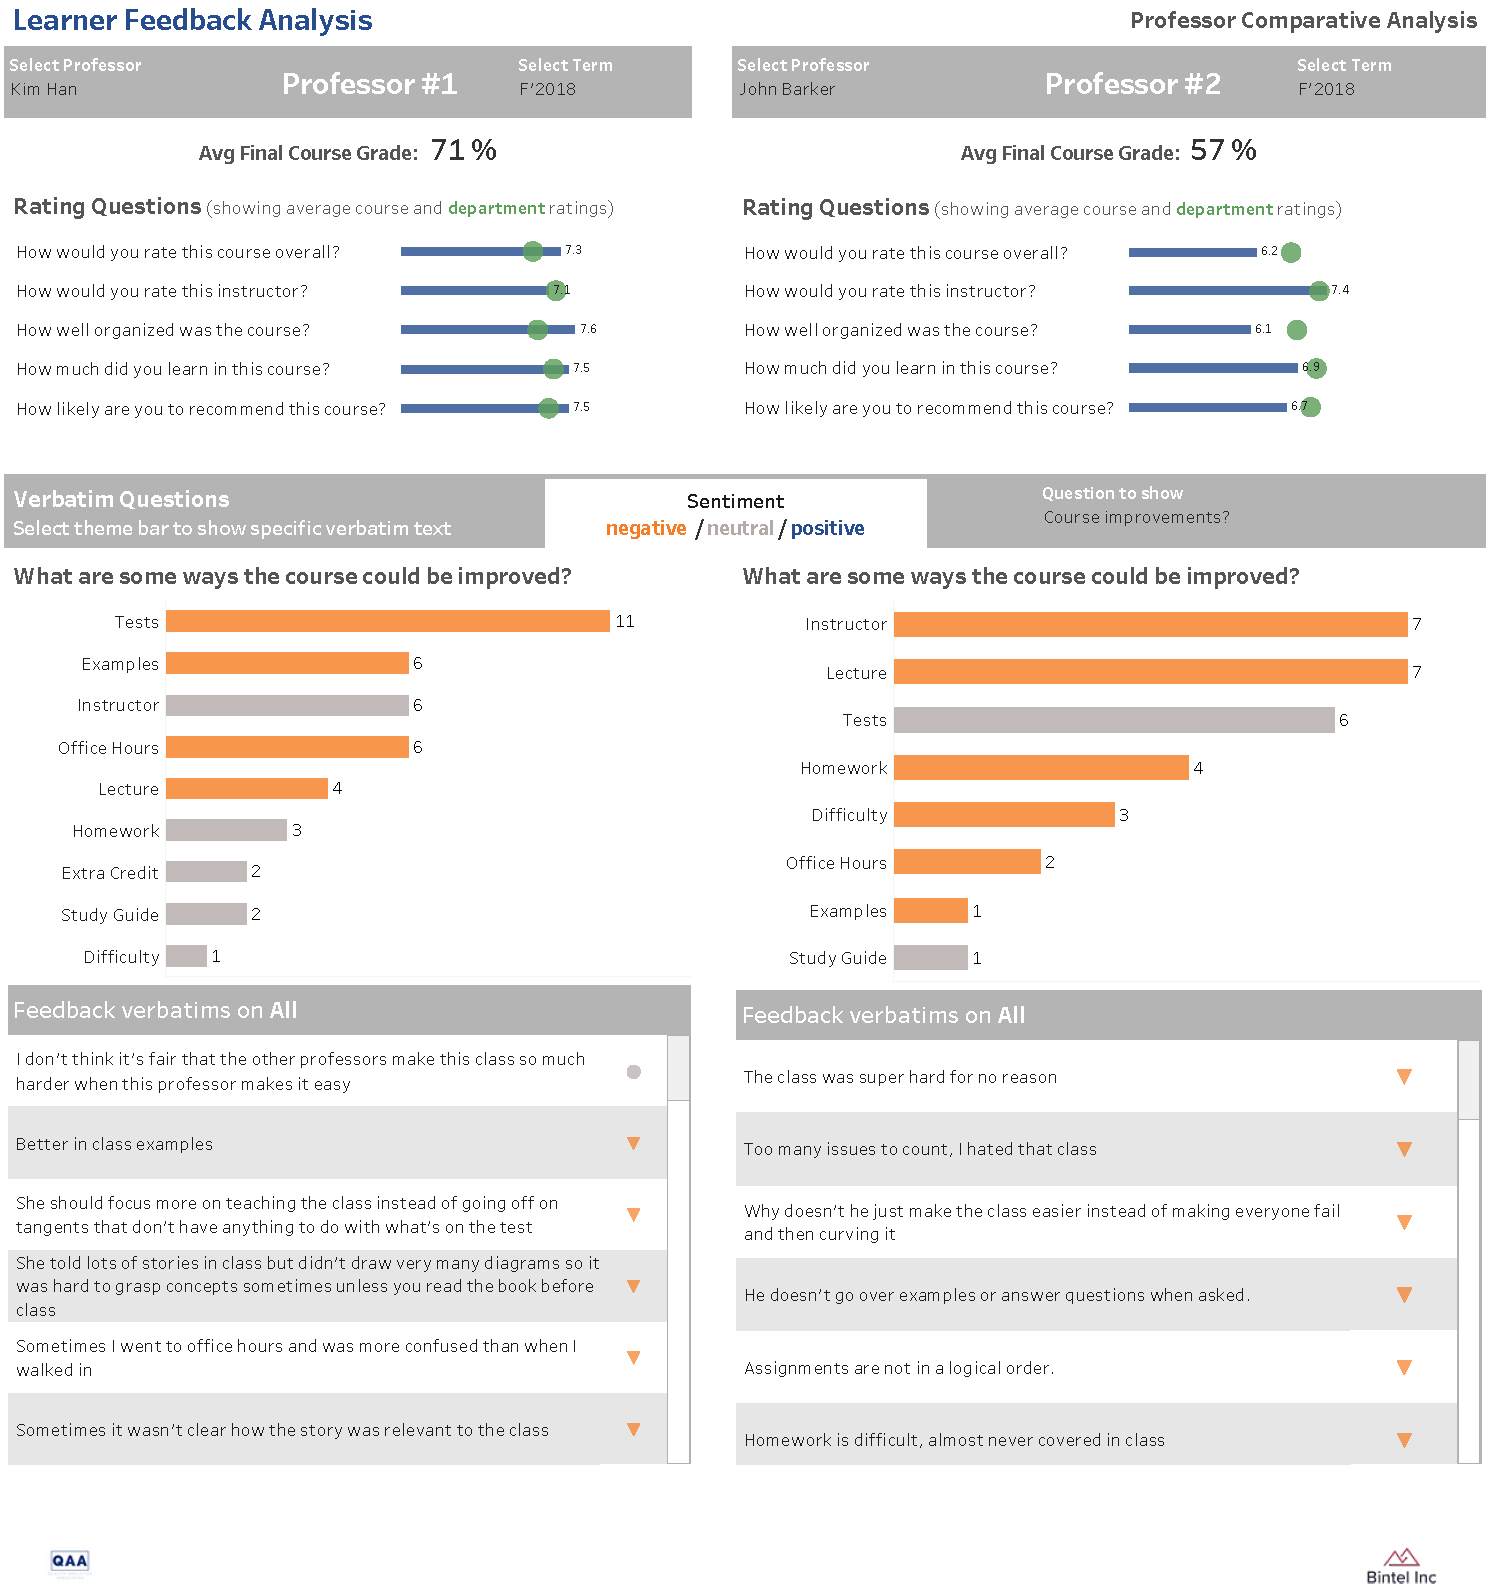
Our team of data scientists will then take the multiple choice answers from the survey (structured data) and the free text responses (unstructured data) and their classifications and build an interactive dashboard. The dashboard will show what topics are being mentioned in the free text responses and how many times. This data will also be connected to their response to the other questions like rating the course overall, so it will be apparent if there are correlations between what people are writing about and their scoring of the training course. A date histogram is also important for analysis to show how groups rated the course and the topics they discussed over time. This will show trends and if any changes are made to a training course it will be easy to view how people responded to that change. QAA will use the data from the dashboard to support their recommendations to clients.
After multiple training courses have been assessed, QAA will be provided with insight that will help them develop future training courses. Their expertise in the area is what makes them successful now, but with the support of good data and artificial intelligence applied to text analytics they will be way ahead of the competition.
Learn more about this project here or download the whitepaper
We have been hard at work putting together an new example so people can see what it would be like to have course evaluation feedback identified. We created an example scenario where two professors teach a chemistry course with different levels of experience and different teaching styles. Spend some time working with the dashboard and let us know what you think! If you're interested in seeing the entire dashboard contact us and we can walk you through it.

INDUSTRY WE WORKED WITH

Education


