We have talked about how learner analytics are beneficial to learners, trainers/instructors, departments, and organizations as a whole, but it's one thing to understand concepts and another thing to actually engage with a solution.
Combining Bintel's years of expertise in AI and data analytics with QAA's extensive background in training and course development and evaluation, we collaborated to build a sample data set and dashboard for people to interact with at their leisure to get a better understanding of the Learner Analytics Solution.
Learner Analytics Solution
You may think you know what your learners think, but are you worried there might be gaps? Are your trainers or professors having trouble improving their course evaluation feedback scores?
If you have limited learning data, AI learning analytics will add a new dimension to the details. Consider what the eLearning Industry discussed about the importance of AI to L&D. Moving beyond the algorithms within the LMS, AI offers an ability to explore limitless possibilities. Of those surveyed, almost 85% believe their company will gain a competitive edge from AI.
From a survey perspective, one option are the open-ended survey questions that could provide more insight than a simple likert scale. AI can be used to target words and themes which would allow universities or organizations to gain more discernment of learning strategic goals.
AI combined with learning analytics will allow for more data to be collected and analyzed at a more expedient, efficient, and effortless rate for your team. More importantly, your university or organization will know the metrics presented for the overall learning return on investment (ROI) is data driven.
Example Scenario
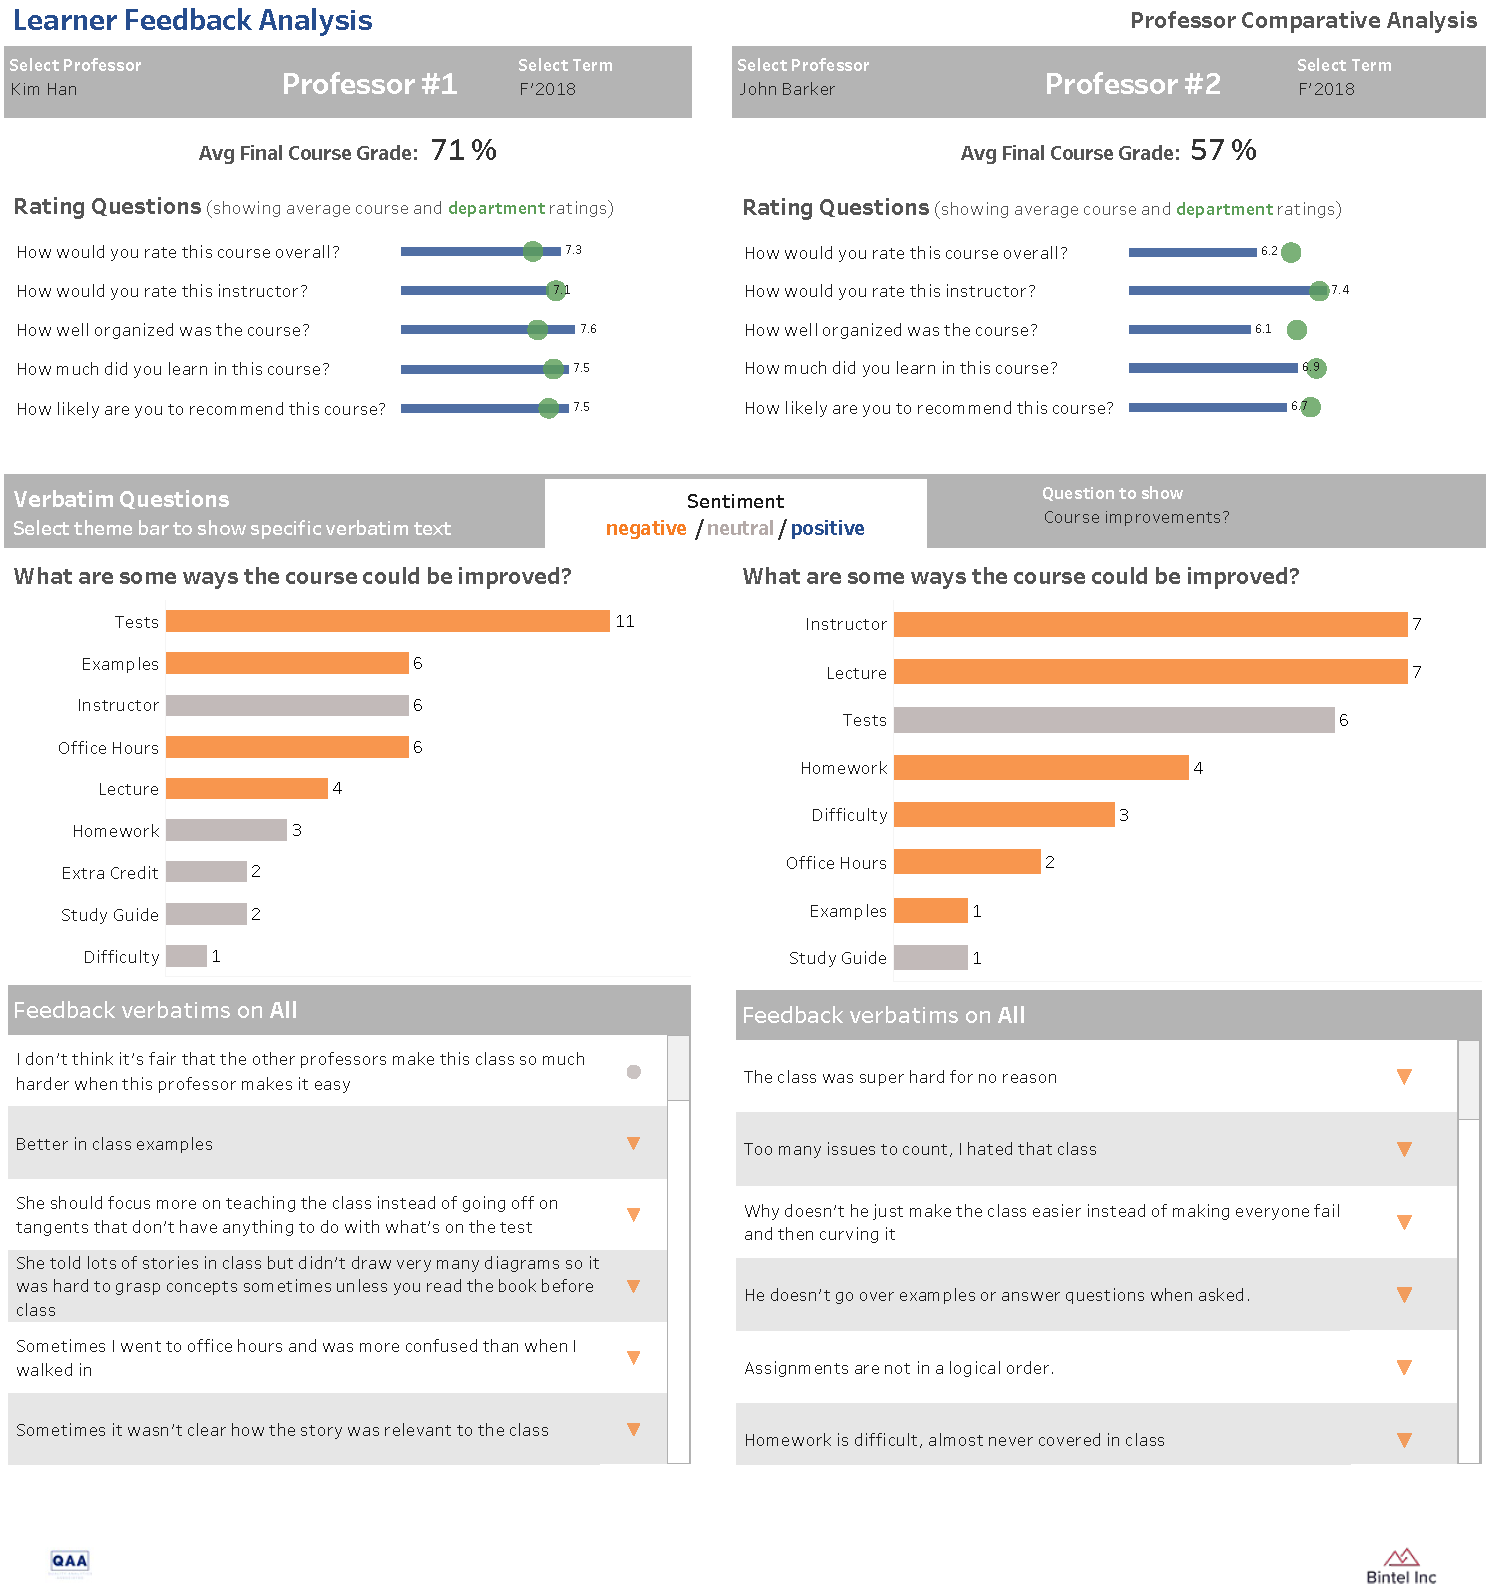
We developed a scenario where two different instructors taught an online Chemistry 101 course over a period of 4 semesters. Each professor had a different level of experience and different teaching styles. We put together an interactive dashboard showing a comparison of the two professors. Please note that all of the feedback and the names have been created for this scenario and have no relation to actual people.
Survey Questions:
- How would you rate this course overall? (1-10)
- How would you rate this instructor? (1-10)
- How well organized was the course? (1-10)
- How much did you learn in this course? (1-10)
- How likely are you to recommend this course? (1-10)
- What did you like about this course? (free text)
- What are some ways the course could be improved? (free text)
Things to think about:
- The classes have less than 40 students in them
- Q6 is focused on positive things about the class and Q7 is focused on negative things about the class, but people do not always put all positive responses in Q6 and all negative responses in Q7
- Sometimes a professor makes a change based on department direction and sometimes they are just trying to be a better instructor, but the student response to changes is not always positive. For example, look at the difference in sentiment surrounding the study guide Professor Kim Han provided between Fall 2018 and Spring 2019. Because the study guide was revised to have less specific content on it, students rated it more poorly and reported the tests being more challenging
This is why it’s important to know what the students are saying about each subject – in their own words!
_____________________________________________________________________________________________________________________________________________________________________
_____________________________________________________________________________________________________________________________________________________________________
Professor Kim Han
Before teaching Chemistry 101, Professor Kim Han had taught at the school for a total of 5 years in the science department. She taught Chemistry for Engineers for those first years and then moved to Chemistry 101 for non-science majors in the Fall of 2018.
She made the following changes to her approach between the semesters:
|
Fall 2018 Themes |
Changes based on feedback |
|
Office Hours |
Took a training on how to better tutor students in 1-on-1 scenarios |
|
Study Guide |
Revised the study guide to contain less content as a result of the departments direction, after students stated that the study guides contained everything on the tests |
|
Homework |
Created her own problem sets for homework so it would be more challenging for students |
|
Lecture/Examples |
She adjusted her lectures to focus more on the content and made sure that any stories or examples she presented tied back directly to the lesson |
|
Tests |
She was more clear in the lectures and office hours about what concepts were going to be on the tests |
|
Spring 2019 Themes |
Changes based on feedback |
|
Lecture/Homework |
She began assigning mandatory textbook reading assignments before class so the students didn’t feel so rushed to get through the content in lecture |
|
Instructor |
She worked on leading students to the correct answer instead of just telling them the correct answer |
|
Difficulty |
She worked on being a more fair grader |
|
Homework |
She began assigning more homework but simpler problems so the students could get more practice working with the concepts |
|
Tests |
She began curving the test scores and made the homework a larger percentage of the course grade |
|
Fall 2020 Themes |
Changes based on feedback |
|
Homework |
She assigned non-mandatory textbook reading assignments for the class so they could familiarize themselves with the material before they went to the lecture |
|
Tests |
Lowered the percentage of weight of the tests of the course grade, made the tests easier and discontinued curving them |
We spelled out the changes for you for Professor Kim Han, but see if you can determine any specific changes that Professor John Barker made in between semesters. Are you able to gain insight even without knowledge of what specific changes were made?
Professor John Barker
He is a young, novice professor who started teaching Chemistry 101 for the university during the fall semester of 2018. John’s first semester was an adjustment for him and more about him becoming comfortable with the syllabus, text and university system. As you can note, the students like his teaching style, but find his one-on-one time during office hours inconsistent.
To help improve this, John enrolled in a self-improvement, conversational style mentoring program. This helped not only with providing him mentorship but gave him skills to mentor others during his office hours. You can see the improved office hour scores in the proceeding semesters.
In addition, John scored because he did not provide extra credit and only provided grades for the tests. After seeing the comments from students, John spoke with others in his department and the chair. He discovered how these professors provided extra credit opportunities and other grade opportunities. John then implemented his own methods for providing extra credit and other grade opportunities to his students. Again, you will note the improvement in his students’ ratings as semesters progress.
John used this as a tool to improve as a novice professor at the university.
Check Out the Dashboard on Tableau Public!
Go to the dashboard and see if you can pick up on the different themes over the semesters.
We published the Professor Comparison Dashboard but contact us if you want to see the entire Learner Analytics Dashboard which includes:
- In depth individual professor performance
- Open source data (from sources like ratemyprofessors.com)